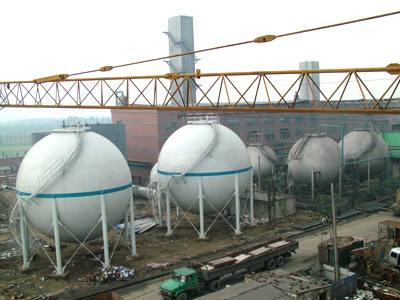
Spherical tank inspection in Shandong Chemical Plant
Brief:At the invitation of Zibo Boiler Inspection Institute of Shandong Province, three of the four 650 cubic meters spherical tanks of Qilu Petrochemical were tested respectively.

I Acoustic emission application type
Spherical tank positioning detection
II Project overview
At the invitation of Zibo Boiler Inspection Institute of Shandong Province, three of the four 650 cubic meters spherical tanks of Qilu Petrochemical were tested respectively. Meanwhile, the other party also invited PAC company of the United States to test the other one. Through comparison, the other party was very satisfied with our testing, and highly praised and recognized the portability and operability of our instruments and equipment and the good technical assistance we can provide!
III Acoustic emission system
Acoustic emission system model: Soundwel 30 channel acoustic emission system
System performance parameters:
Ability to collect, analyze, process, transmit and store hits to hard disk per second (PCs. / s): 70000 / S
Ability to collect, analyze, process, transmit and store waveforms to hard disk per second (bytes MB / s): 100000 MB / S
Host noise level (DB, 0dB = 1uv; sensor output): less than 18db
IV Detection process and detection method
The first step is to investigate the scene and determine the sensor array;
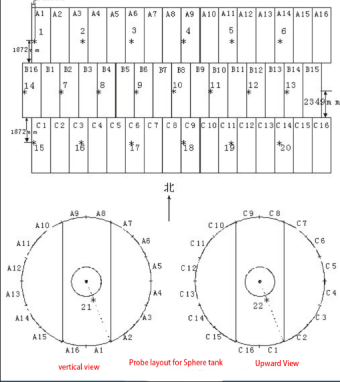
For the 650m3 spherical tank, a total of 26 probes are set (there are 20 probes in the middle layer of the spherical tank, and one probe at the upper and lower bottom, which are arranged in the form of triangular network for overall monitoring. In addition, four probes are arranged on the small column tank below the spherical tank, there are two probes in the middle layer of the column tank, and one probe at the upper and lower bottom). The specific parts are shown in the figure.
*
Layout of acoustic emission sensor probe

The second step is to formulate the inspection scheme and determine the loading procedure
Step 3 Installation of sensor
Since the spherical tank is tested, the sensor adopts sr150. The installation position of the sensor must be polished to remove paint, oxide skin or oil dirt, expose metal luster, apply coupling agent and fix the sensor. The sensor is a vulnerable device, which should be handled with care to prevent collision.
Step 4 Instrument debugging
Set the working parameters of the instrument hardware. These parameters generally include threshold (36dB) and parameter interval (2000) μ s) . locking time (2000) μ s) , sampling frequency (2500khz), sound velocity (3.2km / s), etc.
For background noise measurement, the threshold is generally 5-10db higher than the background noise. Most of the detection is carried out under the medium sensitivity with the threshold of 35 ~ 55dB, and the most commonly used threshold is 40dB. The instrument must be well grounded before collection. If the background noise is large, check whether there is a noise source on site, whether the medium inside the tank flows, whether the sensor is well coupled, etc.
Channel sensitivity calibration
If a channel cannot receive a signal during calibration, check whether the acquisition card of the channel is turned on, and then check the function selection of the channel in the channel parameters. If 3 is selected, no signal can be received; If there are no problems, check the connection of the front end and whether the front amplifier is connected reversely.
The fifth step is to load the experimental program and data acquisition
Before collection, you must remember to save the data first, that is, select the save data check box, and then start collection. After collection, the data will be automatically saved to the location you selected. In the process of data collection, it is necessary to observe the changes of data at all times. It is best for on-site personnel to stay away from the container to avoid unnecessary interference. In case of man-made collision with the tank body, the time and location of the collision shall be recorded for subsequent analysis; If the number of impacts increases rapidly with time, the loading shall be stopped until the cause is found
V Inspection effect and conclusion:
This test is to conduct overall acoustic emission monitoring and data acquisition during the pressurization of the device. The pressure starts from 0.8MPa to collect data from the inspected spherical tank, and a total of three pressurization cycles are carried out. See acoustic emission data chart for test results.
According to GB / t18182-2000 acoustic emission testing and result evaluation method for metal pressure vessels, seven effective acoustic emission positioning source signals AS1, as2, AS3, AS4, As5, as6 and as7 are obtained in the whole monitoring process, as shown in the figure.
Inspection and evaluation conclusion:
Acoustic emission source synthesis according to GB / t18182-2000 acoustic emission testing and result evaluation method for metal pressure vessels
According to the classification, the comprehensive grade evaluation of AS1 ~ as7 acoustic emission sources is as follows: × Represents signal and ○ represents no signal
|
No |
boost Pressure maintaining Boost Pressure maintaining |
Activity |
Strength |
Grade |
|
AS1 |
× × × ○ |
Medium activity |
Low strength |
C |
|
AS2 |
○ × ○ × |
Medium activity |
Low strength |
C |
|
AS3 |
○ × ○ × |
Medium activity |
Low strength |
C |
|
AS4 |
× × ○ ○ |
Medium activity |
Low strength |
C |
|
AS5 |
○ × × ○ |
Medium activity |
Low strength |
C |
|
AS6 |
× × ○ ○ |
Medium activity |
Low strength |
C |
|
AS7 |
× ○ × ○ |
Medium activity |
Low strength |
C |
According to the test result evaluation of GB / T18182-2000 <<acoustic emission test and result evaluation method for metal pressure vessels>>, the above seven acoustic emission sources shall be subject to ultrasonic re inspection.


